Families of Functions
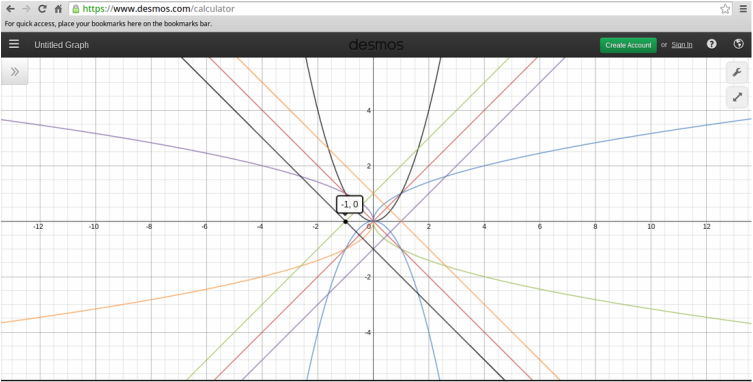
Today, we took the time to create a piece of art using Desmos. In this piece of art, we used different kinds of functions to make something that looks interesting. In my artwork, I used a lot of simple functions, like y=x+1 and y=x^2. But even using simple functions that are easy to understand can make a pretty cool piece of art, and I think the coolest part of mine is the giant X that appeared in the center.
PieceWise functions
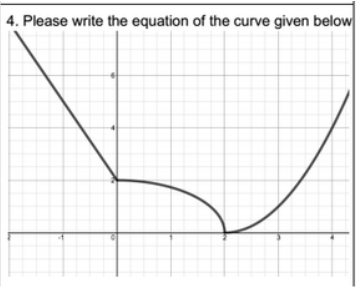
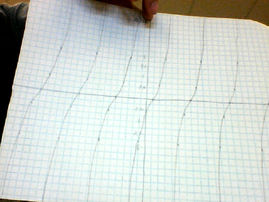
In the picture located above, you can see something called a piecewise function. While looking at it initially, it was hard to determine how we could possibly write a function that describes the graph. But, after some instruction, we learned that it was actually quite easy. As you can see when looking more in depth, this graph is made up of 3 different functions. The function for this line goes something like this:
{y=x+2 if x>0}
{4=x^2+y^2 if x and y=>0}
{y=(3/4x-2)^3 if x>2}
{y=x+2 if x>0}
{4=x^2+y^2 if x and y=>0}
{y=(3/4x-2)^3 if x>2}
Basketball video
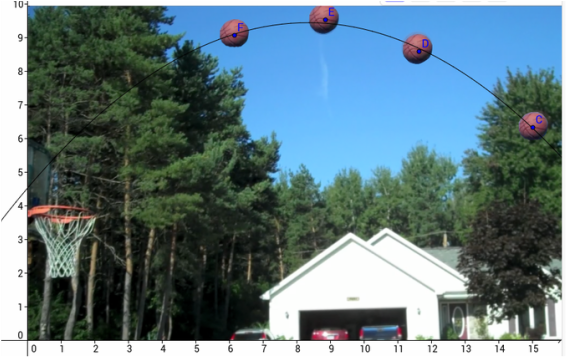
In the picture above, you can various still shots of a basketball on it's way to the net. Using Geogebra, we were able to plot points over the basketballs and create a parabola to determine if it would make its way in the basket. This was a pretty neat little project, it was quite interesting to me that I was able to plot points. In my opinion, I'm going to say that it will indeed make it in the basket after it rebounds off the backboard. However, I can't be too sure, because it's possible that it might bounce right off and back to the ground, I'm not sure of the physics behind it.
Skateboard-Slope Activity
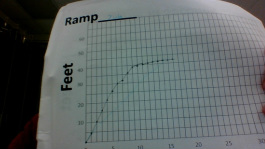
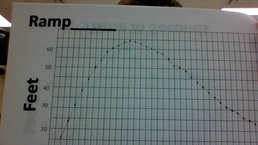
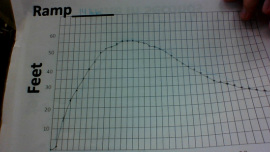
In this activity, we were asked to watch 3 videos of a skateboard going down a ramp at heights of 21, 14, and 7 inches. Length measurements were written on the ground and we had to examine how for the skateboard went forward, and then backwards.Then, we graphed both a guess at what the graph would look like, and looked closer to see what the graph actually looked like.
In this activity, we were asked to watch 3 videos of a skateboard going down a ramp at heights of 21, 14, and 7 inches. Length measurements were written on the ground and we had to examine how for the skateboard went forward, and then backwards.Then, we graphed both a guess at what the graph would look like, and looked closer to see what the graph actually looked like.
|
Most of my predictions for all three of the graphs weren't very accurate, with the exception of graph 2. I wasn't able to relate where the skateboard was on the driveway very well with how much time had passed, which resulted in an inaccurate estimate. Initially, I didn't consider things like the skateboard stopping for a long period of time when it reached its peak, or the fact that it would go more slowly backwards than it would forward. These things also led to inaccuracies.
Let's take a look at the domain and range of each of these graphs. For the first 2 graphs, the domain is clearly (0, 36), because the graph only allows us to show how far the skateboard traveled from point 0 (the starting point) to a time of 36 seconds (the end of the graph). Graph three is different, because we saw the skateboard stop before it reached a full 36 seconds passed. It stopped at 17 seconds, so the domain is (0,17) For the range, we are able to measure up to a total of 64 feet traveled. For graph 1, which was the 21-inch ramp, the skateboard managed to travel the full 64 feet. So, the range for this graph is (0,64). Graph 2 was the 14 inch ramp, and it was a little different. The skateboard only traveled to a total of 55 feet, so the range is (0,55). Now for the final 7-inch ramp graph. This time, we saw the skateboard go only 43 feet, so the range comes out to be (0,43). Branching away from domain and range, let's examine the minimums and maximums as well as the zeroes that are on all three of the graphs. The are the same on all three graphs, the only one is (0,0) which is the origin. This represents the starting point of the skateboard and the timer. Maximums and minimums are all very similar on all of the graphs - they all reach a certain maximum point when the skateboard starts to go backwards, and one could say that when the skateboard comes to a complete and total stop on it'd backward travel that that's the minimum on all of the graphs. It's interesting to note that these 3 graph's maximums were always located in the 10-15 second range. Also, the steeper the slope of the ramp, the higher of a maximum the graph will have. The steepness of a the graph, or in other words, the steepness of the slope, represents how fast the skateboard is traveling on the driveway. When the skateboard is first released down the ramp, that's when it will be traveling the fastest and have the steepest slope. The slope will always be faster when the skateboard is traveling forward from the ramp because there's more momentum. When it starts to travel backwards, the slope was always much less steep because it was traveling at a much lower speed over a longer period of time. And so concludes this examination of the Skateboard-Slope Activity! Inverse Functions Activity
In this activity, our objective was to discover the inverse of the function y=x^2. To do this, we switched the y values with the x values to get x=y^2. The next step was to take the square roots of both sides, getting our final answer of y=+or- the square root of x.
If you take a look at the graph we made, both the original function and the inverse function are reflected over the function y=x. That's actually something that I learned from this activity, I didn't know that when something is reflected over y=x that it becomes a function, and that's probably useful information. As for the question of "can a function have a function that is also a function, the answer is yes, it can. Think of something simple like y=x+3. The inverse for that function is y=x-3, and that is definitely a function. connecting zeroes and factorsIn this activity, our goal was to learn about the connections between zeroes, factors, and also polynomials division. As the assignment was completed, I figured out how factors and zeroes are connected, as well as why factoring polynomial helps you figure out the zeroes. I learned why synthetic division works, and why we do it in the first place.
When we factor a polynomial, it's not always an easy thing to do. Sometimes it helps to find an easy zero by graphing the equation on Desmos, and using it to synthetically divide and get a quadratic function, which we can use to more easily discover zeroes. Alternatively, we can even just plug a quadratic into the quadratic formula to find the zeroes as well. To offer an explanation of the difference between zeroes and factors, factors are the broken down components of what make up a function. Example: x^2+x becomes x(x+1) in it's factored form. From this factorization, we're able to more easily find the zeroes of the original function. The zeroes of a function are the points on the graph where the line passes through the x-axis, and we can find these by setting everything equal to zero. x=0 x+1=0 x=-1 The zeroes of this function are -1 and zero. So, while factors and zeroes are not the same thing, they are very much related. Some of the other things that I learned from this assignment was that the degree of a polynomial (the highest exponent) will determine the number of zeroes. So if a function starts with x^4, it will have a total of 4 zeroes. This is because it shows how many times the function will touch the x-axis. limits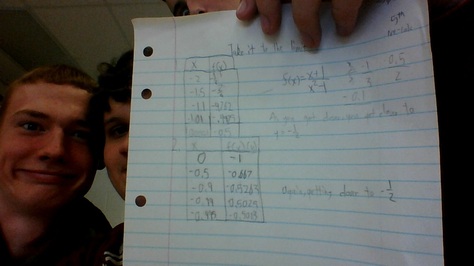
What are limits, and how can we tell if they exist? These questions (and others) were asked in this assignment, and the image above is a picture of my data table.
So, what are limits? Limits are the number that the output of a function is approaching, based on how close the x value of the function is towards a certain number. The example function used in the assignment was f(x)=(x+2)/(x^2-1). We know that x in this function cannot equal -1, because that would make the denominator equal to 0. So, as x approaches -1, we get closer to the limit, which in this example is -1/2. We can tell if a limit exists based on the domain of a function. If there is an x-value that will make the denominator equal 0, the function has a limit. Limits do a great job of explaining points of discontinuity on a graph. When there is a point of discontinuity, you have a limit. Because the bottom of a function cannot = 0, we're able to pinpoint the point of discontinuity by knowing what the x and y value are. In this example, the x value was -1 and the y value was -1/2. folding to the moonHow many times would it take to fold a piece of paper all the way to the moon? Well, about 42!
Of course, this is not at all realistic. It's impossible to fold a piece of paper more than 7 times. But, if you could, that paper would have a incredibly small width, and it probably wouldn't even be visible to the naked eye. This matters because even though this is impossible, if we could keep on folding, the paper would get infinitely smaller in width while also getting infinitely longer. This is an example of exponential growth. 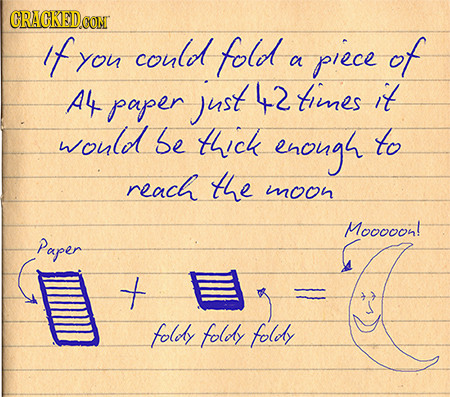
College Loans project
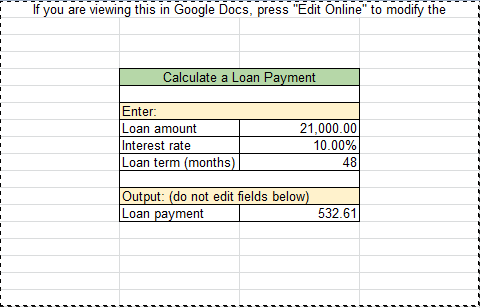
^ (Example of a loan monthly payment calculation)
If I were to take out a 4 $5000 loans over the period of 4 years to use for college, how long would it take to pay it back? Before I answer that question, I have to learn about Government Subsidized loans, Un-Subsidized loans, and bank loans:
Government Subsidized These types of loans are much more desirable than others, because the main difference with them is that the government will pay your interest while you're in school. But, once you're out of school, the interest becomes your responsibility. The interest rate is 4.66% per year. Government Un-Subsidized This type of government loan means that the government will not pay for your interest. The interest rate remains the same at 4.66% per year for UNDERGRADUATES, but jumps up to 6.21% per year for GRADUATE students. Bank Loans This type of loan is not given by the government, but rather by US banks. The interest rate is usually higher, and these types of loans are also harder to get because you need to have a cosigner that agrees to pay off your loan if you fail to do so. _________________________________________________________________________________ So, there are a few different avenue's I could take when it comes to paying off my student loans in the future. Regardless of what path I take, before interest is added into the equation, I would owe a total of $20,000 after 4 year of loans. Assuming that I didn't attempt to pay off my loans while I was in school (which would probably be the likely path, because I didn't have any money to just pay for the education up front anyway), and that I was able to get all government subsidized loans, the interest would not add up as quickly. However, after the 4 year period was up and I was out of school, the interest would begin to accumulate and be factored into monthly payments. Using an excel spreadsheet I found online, I was able to calculate what my monthly payments would be: Under strictly Government Subsidized loans and having the 4.66% interest factored in after school, my payments would be $457.51 a month! This would take a ridiculously long time to pay off. Assuming I was able to pay each month on time, it would take 3 1/2 years. And that's a huge amount of money to be spending. Under Un-subsidized loans, the cost grows even greater. The interest adds up over the course of my education, and there's even a bump in interest after I graduate! Just over those 4 years in school, you wrack up nearly 1000 dollars in interest, so you already owe $21k. And now, your interest piles up, and your payments are almost $500 a month until you pay it all off. I don't even know how this is manageable, but if you pay it off the way you're supposed to, the payments are incredibly high. Using bank loans would make this even more scary. Having 10%+ in interest would jack the price even more. This project made me realize that I should really go for as many scholarships as a possibly can. Everyone says that college is really expensive, and I always thought loans would make it okay and affordable in the end, but how can I live comfortably having to pay that much money each month? I would probably be okay in the end, but I hope I can get some suitable scholarships so that I can enter my adult life with only a manageable amount of debt! Unit circle - sine, cosine, and tangent
Over the past few days, I was learning about the unit circle, and how you can use it's properties to learn about sin, cosine, and tangent. We placed triangles along the radius of the circles, and the use the angles to find sin, cosine, and tangent. This whole activity helped me understand more about what sin, cosine, and tangent actually are, as well as with the understanding of radians, and coterminal angles.
The way I understand it, we're using the triangles to see what lengths of the triangle are equal to Sin, Cos, and Tan. It's a very useful way of finding the lengths of right triangle sides, and seeing what angles will equal a certain side length. This is something that's very difficult to put into words, but I truly do understand it. graphing trigonometric ratios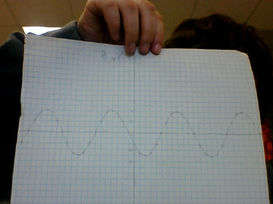
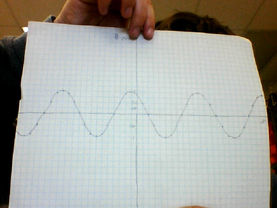
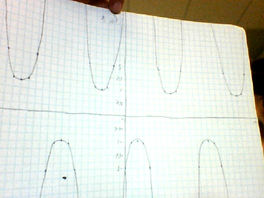
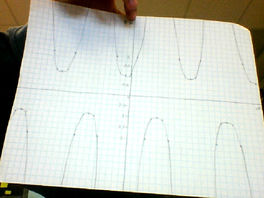
(In order from top to bottom): Sin Wave, Cos Wave, Tan Wave, Csc Wave, Sec Wave, Cot Wave
What is the period and amplitude of each graph? Well, for Sin and Cosine, the amplitude of the waves is 1, and the period is 2pi. This is interesting to me, because having a period of 2pi means that the length of a wave is exactly equal to the circumference of a circle. It's also intriguing that cosine and sin are almost exactly the same, and that the only difference between them is their position on the x axis. Csc and Sec are just the inverse of Sin and Cosine, and have an infinite amplitude because of how the continue on the Y-axis. Tan and Cot and different from the others. Unfortunately, I'm not really sure why, but I can make some observations. Based on what I'm seeing, it looks like the period of Tan and Cot is simply pi, and their amplitude is infinite. The only different between Tan and Cot is that they are both mirror images of each other. Comparing Sin and Cosine Sin and Cosine have many more similarities than they do differences. First off, the period of each is the same, and are both 2pi. There's nothing different about this. The amplitude is also the same, and is simply 1. So what's different about them? The only one I'm seeing is that each wave is shifted 1/2 pi down the x-axis. I can't think of a reason for this, but I'm sure it's probably a simple explanation. As a side note, I really like the way that these waves line up on Desmos - they look like a DNA strand. Vertical Asymptotes In order to understand why Tan's, Cot's, Csc's, and Sec's vertical asymptotes are located where they are, we have to look at what these functions actually are. Cot, Sec, and Csc are the inverses of their parent functions. So, when 0 is going to end up on the bottom of an inverse, there will be an asymptote. These occur every pi units on the x axis for all of these functions. Tan is slightly different. Tan=Sin/Cos, so if cosine is going to equal 0, you will have your vertical asymptote. arduino sound wave
The file above is an example of an ambulance sound that was produced using an arduino.
Unfortunately, I haven't the slightest clue as to what in the program was changed to produce this sound, because Kaden was in charge of the programming entirely. What I do know a little about is what we created here. An ambulance siren is basically a Sin wave, so that's what we're hearing. The up, the down, and back to where it started in the sound represents the wave perfectly. When the siren speeds up at the end, that's still a sin wave - but the frequency becomes much higher, and the wavelength much shorter. Polar graphingUnfortunately, for this blog, I went home sick and didn't get the full effect of that day's lesson. But, with some help from Kaden Keon, I messed around with Desmos and found out what everyone did that day.
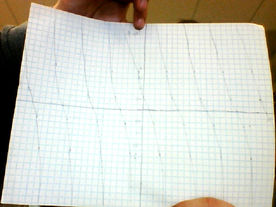
Here's my attempt at creating a rose: 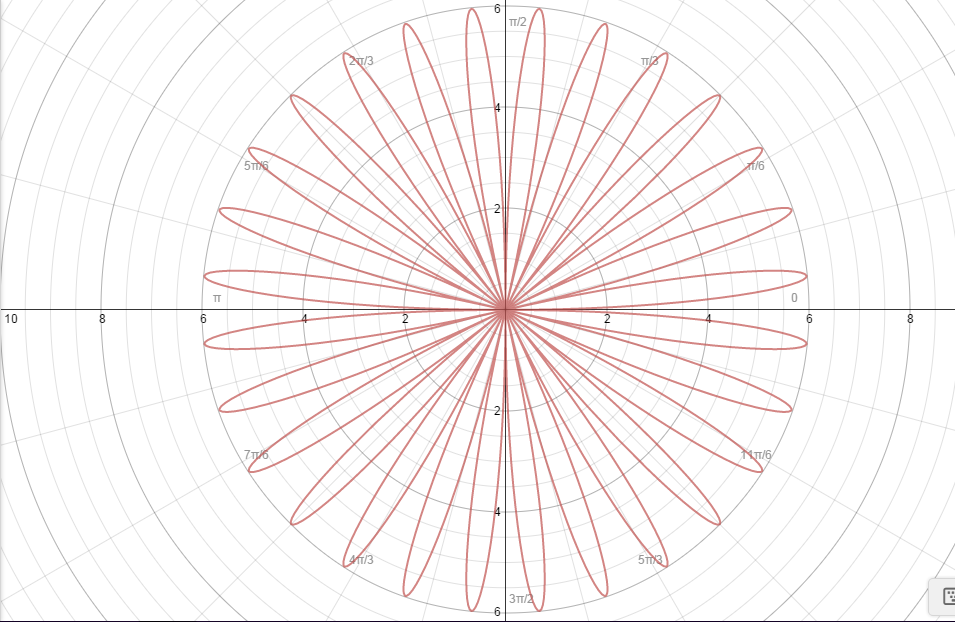
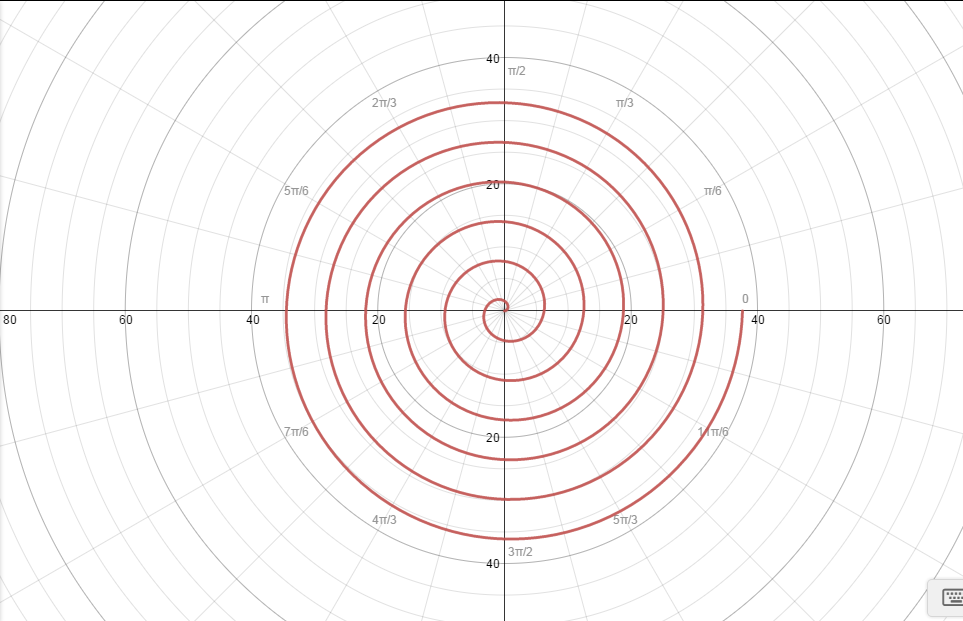
It seems that, in class, we also experimented with spirals, created by using the equation r=theta. Here's what that looks like
At this point, students were asked to experiment with these equations, and make their own flowers. I did my best with what I know to come up with this:
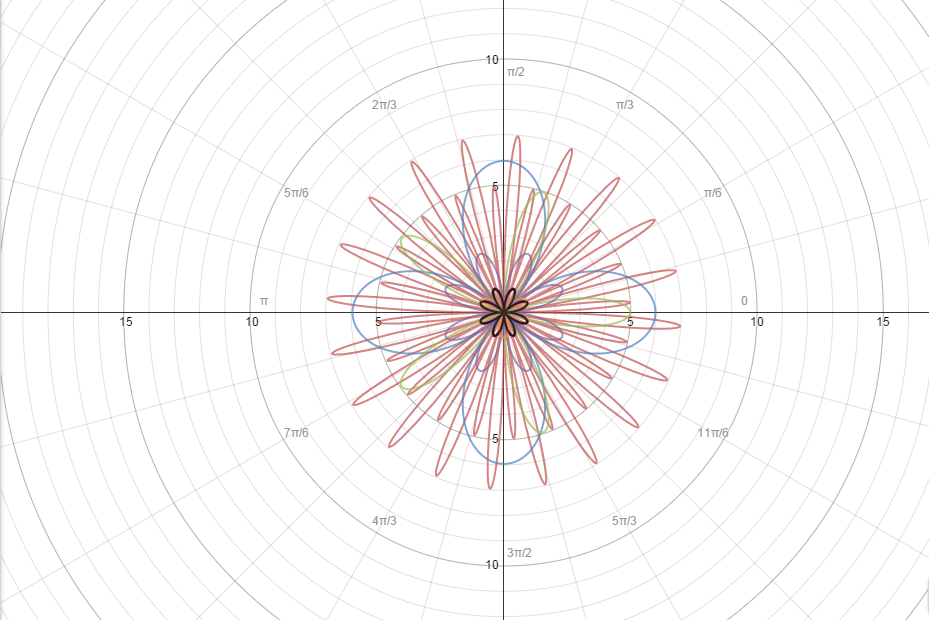
It isn't by any means perfect, but I think it's incredibly neat that you can make something so cool by just inputting a few simple equations!
|
| ||
